#MakeoverMonday: Improving How We Visualize and Analyze Data, One Chart at a Time, 1st Edition
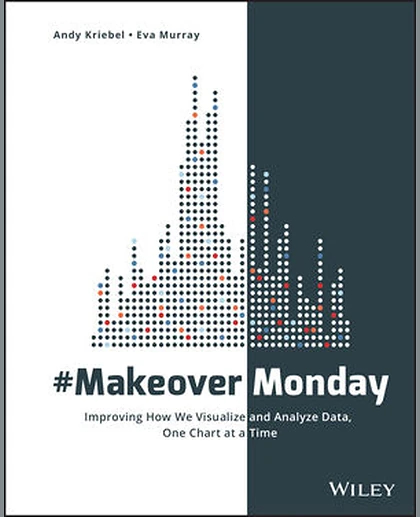
#MakeoverMonday: Improving How We Visualize and Analyze Data, One Chart at a Time, 1st Edition
Summary
Explore different perspectives and approaches to create more effective visualizations #MakeoverMonday offers inspiration and a giant dose of perspective for those who communicate data. Originally a small project in the data visualization community, #MakeoverMonday features a weekly chart or graph and a dataset that community members reimagine in order to make it more effective. The results have been astounding; hundreds of people have contributed thousands of makeovers, perfectly illustrating the highly variable nature of data visualization. Different takes on the same data showed a wide variation of theme, focus, content, and design, with side-by-side comparisons throwing more- and less-effective techniques into sharp relief. This book is an extension of that project, featuring a variety of makeovers that showcase various approaches to data communication and a focus on the a