Excel Data Analysis: Your visual blueprint for analyzing data, charts, and PivotTables, 1st Edition
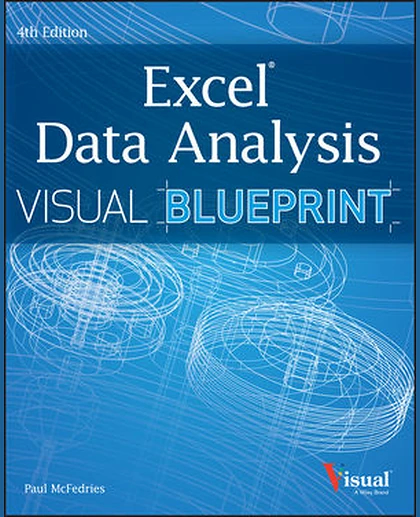
Excel Data Analysis: Your visual blueprint for analyzing data, charts, and PivotTables, 1st Edition
Summary
Professional-level coverage and techniques for Excel power users Aimed at Excel power users who appreciate logical, clean explanations of techniques, this visual guide features numerous screenshots and easy-to-follow numbered steps in order to show you how to perform professional-level modeling, charting, data sharing, data access, data slicing, and other functions. You'll find super techniques for getting the most out of Excel's statistical and financial functions, Excel PivotTables and PivotCharts, Excel Solver, and more. Demonstrates how to crunch and analyze Excel data the way the professionals do in an uncluttered, visual style Offers a clear look at power-using the new Excel 2013, the latest version of the world's leading spreadsheet application from Microsoft Expands your Excel knowledge and helps you use Excel data more efficiently Explains how to retrieve data from d